


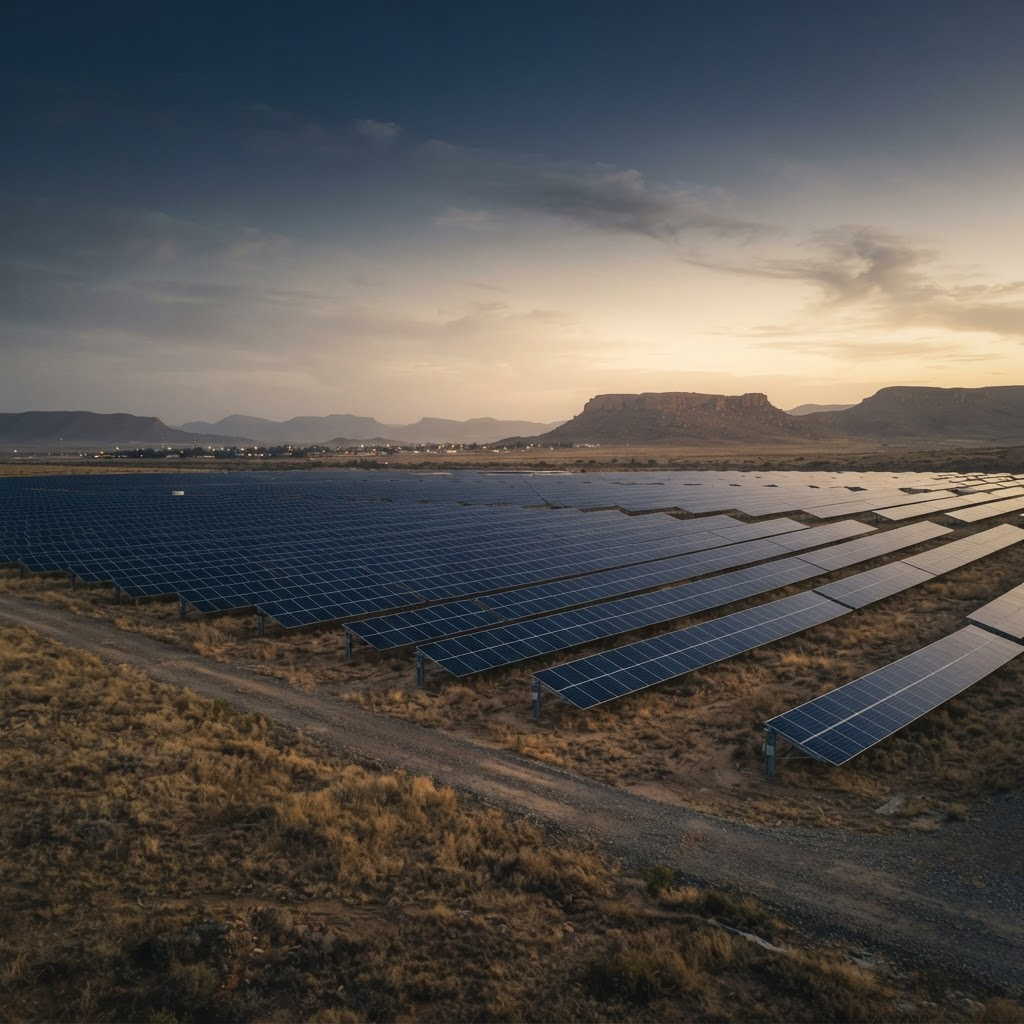
From Passive Procurement to an Active Municipal Energy Engine
Current status, vision and objectives, targeted impact and community benefits — grounded in the DBNLM PV & BESS engineering design.
Why Change?
The current bulk-energy position exposes the municipality to every kWh purchased externally, high peak-period costs and above-inflation tariff escalation.
The structural problem
Can electricity procurement be transformed from a cost liability into a municipal energy value engine?
Current Programme
From concept to operating asset
Standard-period displacement
Evening peak arbitrage
Solar path
Battery path
Presented as a proof-of-concept / Phase 1 validation of the underlying mechanism.
MyMunic Smart Energy Platform
The digital energy operating system
UtCS MyMunic Smart Energy Platform
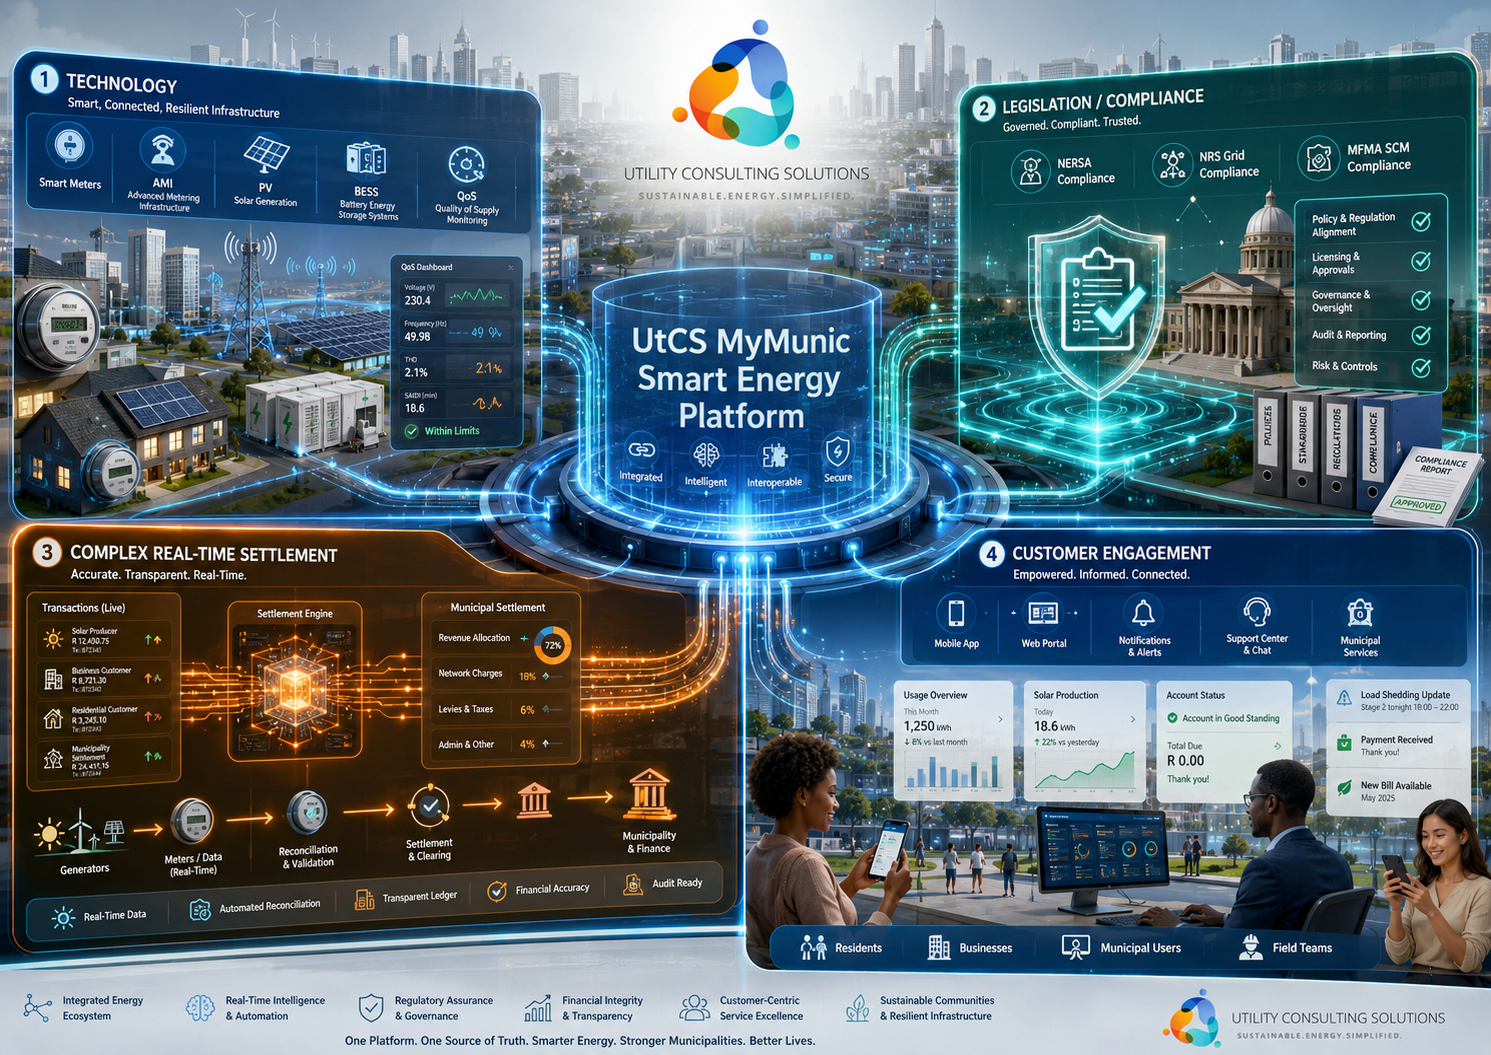
Technology
- Smart Meters
- AMI
- PV
- BESS
- Quality of Supply
Legislation / Compliance
- NERSA
- NRS Grid Compliance
- MFMA / SCM governance
Real-Time Settlement
- Meter data validation
- Energy trading
- Revenue allocation
- Reconciliation
- Auditability
Customer Engagement
- Residents
- Businesses
- Municipal users
- Field teams
- Dashboards
In residents' hands
The MyMunic app
The same rail, in every resident's pocket — one place to trade clean energy, track municipal rebates and see the community impact of their own generation.
Illustrative product concept. Click to enlarge.
Clean Energy
Trade clean energy with confidence.
Municipal Benefits
Earn rebates that strengthen our communities.
Real Impact
See how your actions create a greener future.
Balance visible to the resident
R 325,22electricity trading + municipal rebates
MyMunic =
Foundational municipal energy trading rail
Existing SSEG / EPM Participation
The core mechanism is already demonstrated in Graaff-Reinet — real generators, metered and settled.
Live source system
UtCS MyMunic — Alternative Generators dashboard
The figures above are drawn directly from the operational MyMunic report for Graaff-Reinet — metered export by generator type, monthly generation trend and geolocated participants.
Live operational MyMunic report — actual metered generators, settled and geolocated. Click to enlarge.
Already demonstrating the core mechanism
Scale Vision — PV + BESS
Full Eskom Baseline
Status quo
- PV
- 0
- BESS
- 0
- Annual bulk cost
- R212.83m
- Indicative annual saving
- R0
- Bill reduction
- 0%
All-Peak BESS
Recommended engineering scenario
- PV
- 711.9 MWp total design
- BESS
- 126.5 MWh / 18.5 MW
- Annual bulk cost
- R156.19m
- Indicative annual saving
- R56.65m
- Bill reduction
- 26.6%
Evening-Peak BESS
Alternative design
- PV
- 320.4 MWp total design
- BESS
- 54 MWh
- Annual bulk cost
- R184.37m
- Indicative annual saving
- R28.46m
- Bill reduction
- 13.4%
Eskom TOU composition
Annual GWh by period
Scenario annual bulk cost
R millions per year
Indicative annual saving
R millions per year
Engineering-design scenario values — subject to financing, regulatory approval, site validation and implementation. These are not presented as guaranteed financial outcomes.
Community Impact
The objective is bigger than solar.
Smarter municipal energy
The programme creates an architecture through which municipal energy, customer generation, digital metering, settlement and financial participation can become part of one integrated local energy economy.
Strategic Opportunity — The Long-Term Prize
≈ R1.17bn
Scenario B — cumulative indicative saving over 10 years
≈ R803.4m
Scenario C — cumulative indicative saving over 10 years
Moving from passive energy procurement toward active energy portfolio management.
Implementation pillars